Recently I had the opportunity to cooperate with @start.network/ on a project that monitors 10 rural regions in the area and gathers information directly from correspondents over the territory.
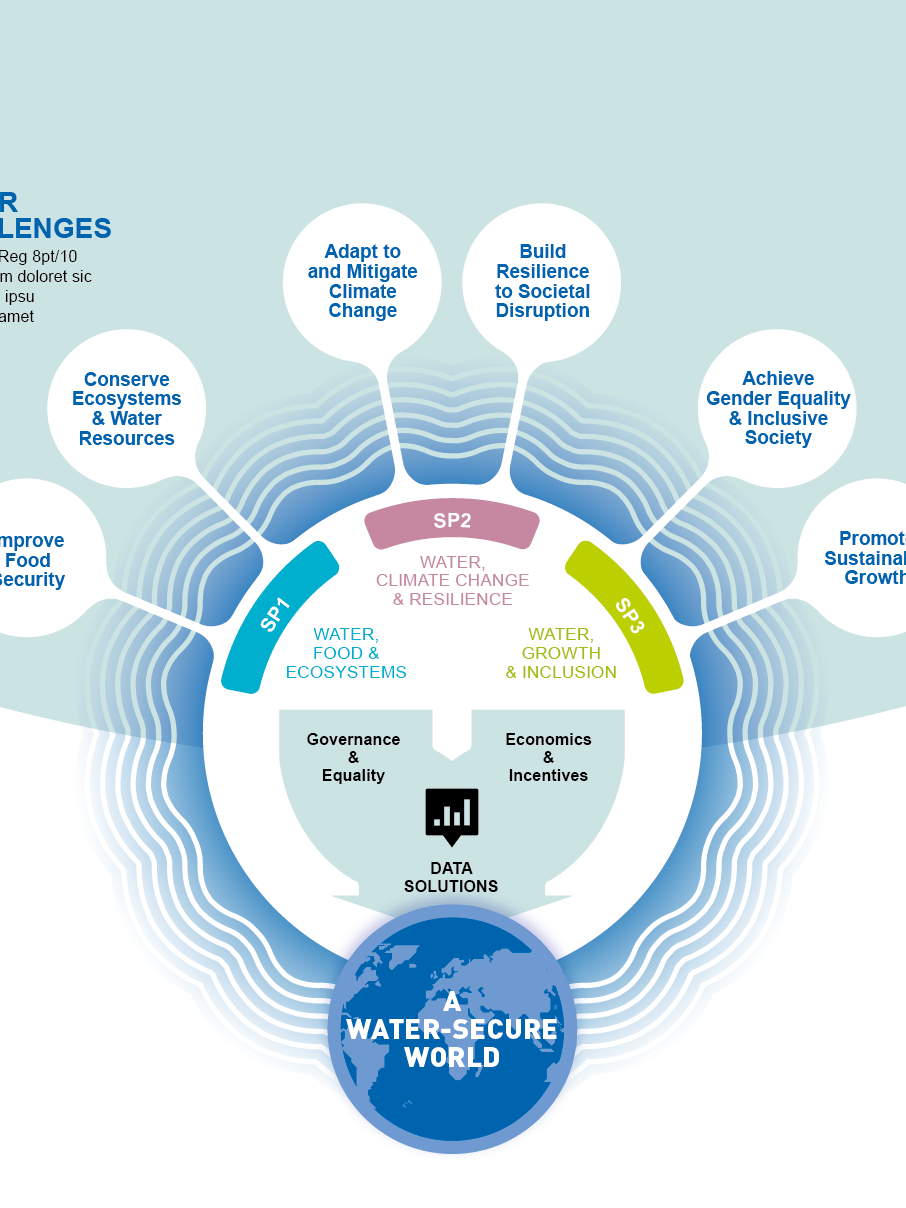
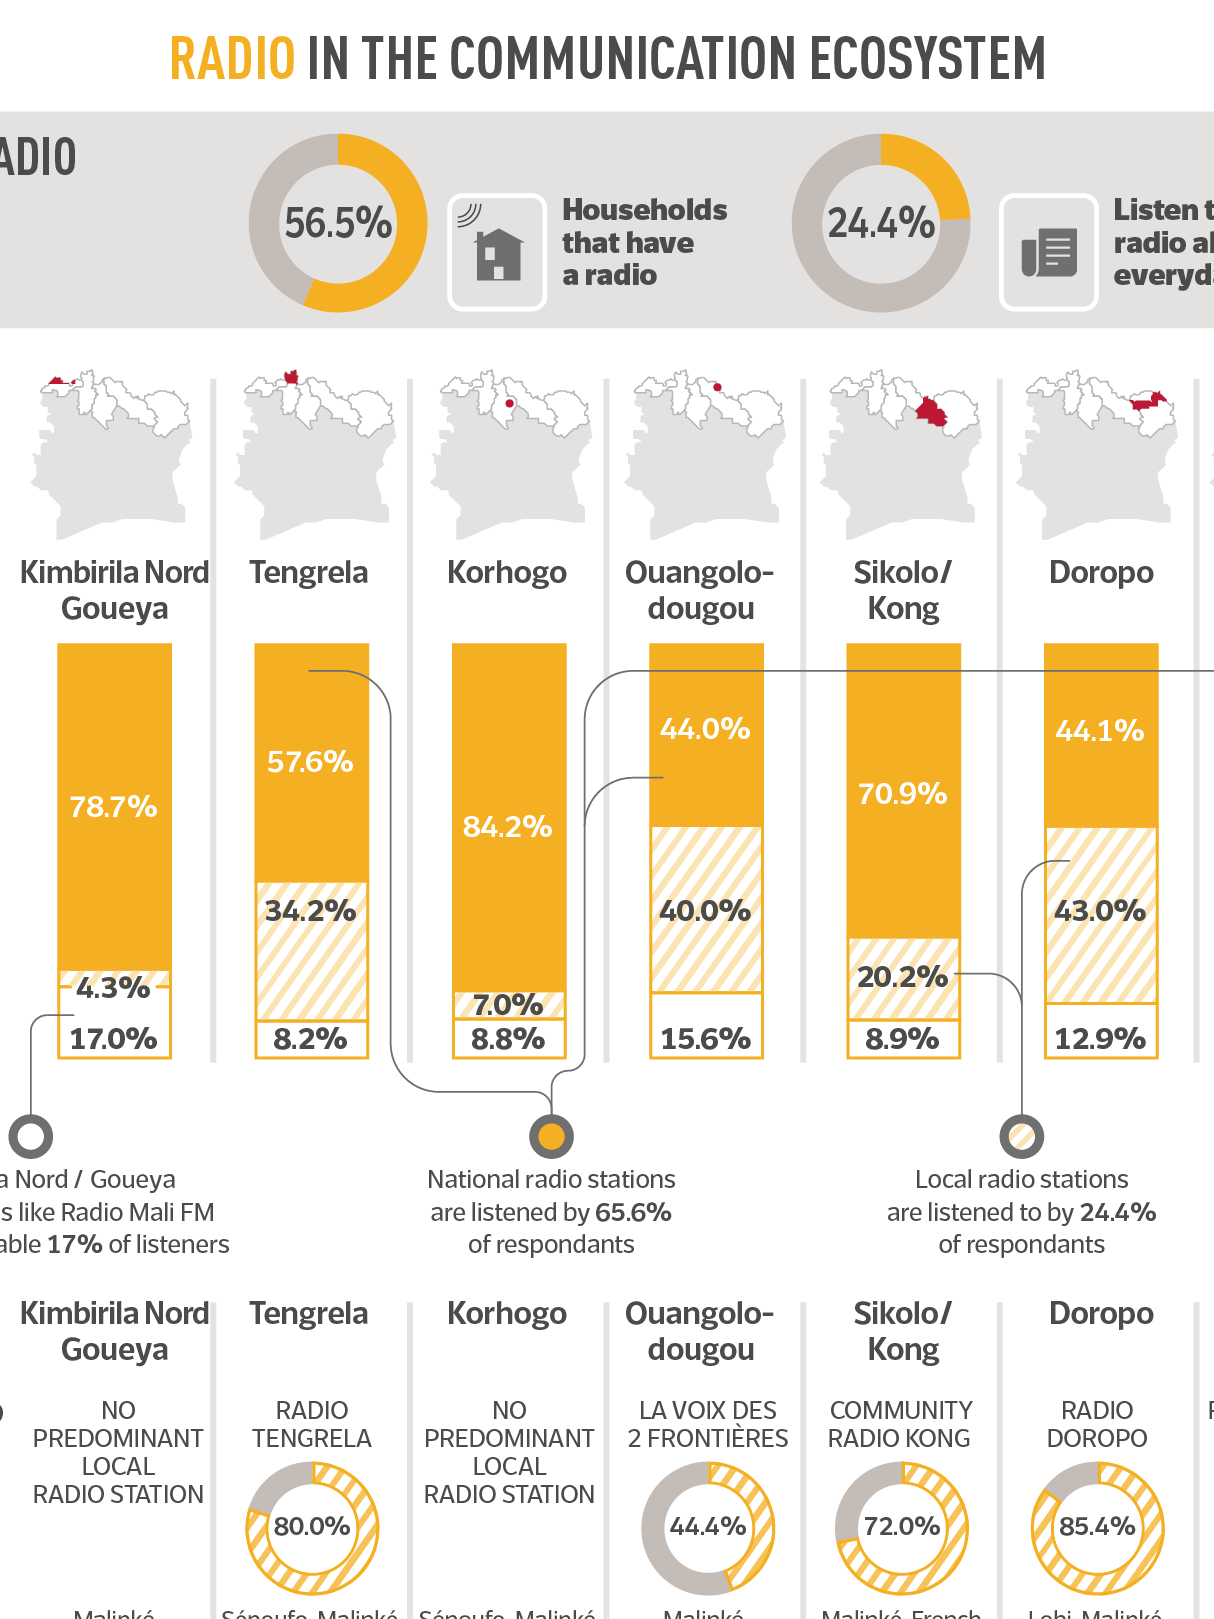
The results are a set of infographics covering topics like weather conditions, water availability, malnutrition, markets, loans, and livestock throughout 2021. All in 2 languages, accompanied by an explication video on how to read the data (next post) and a description of the brilliant pool risks mechanism SN has invented.
This was the initial information gathered, I would say very qualitative!

