Infographic for Titlemax: “Average Commute to Work by State and City”
Average Commute to Work by State and City
A client infographic about average commuting time in the US
You may also like
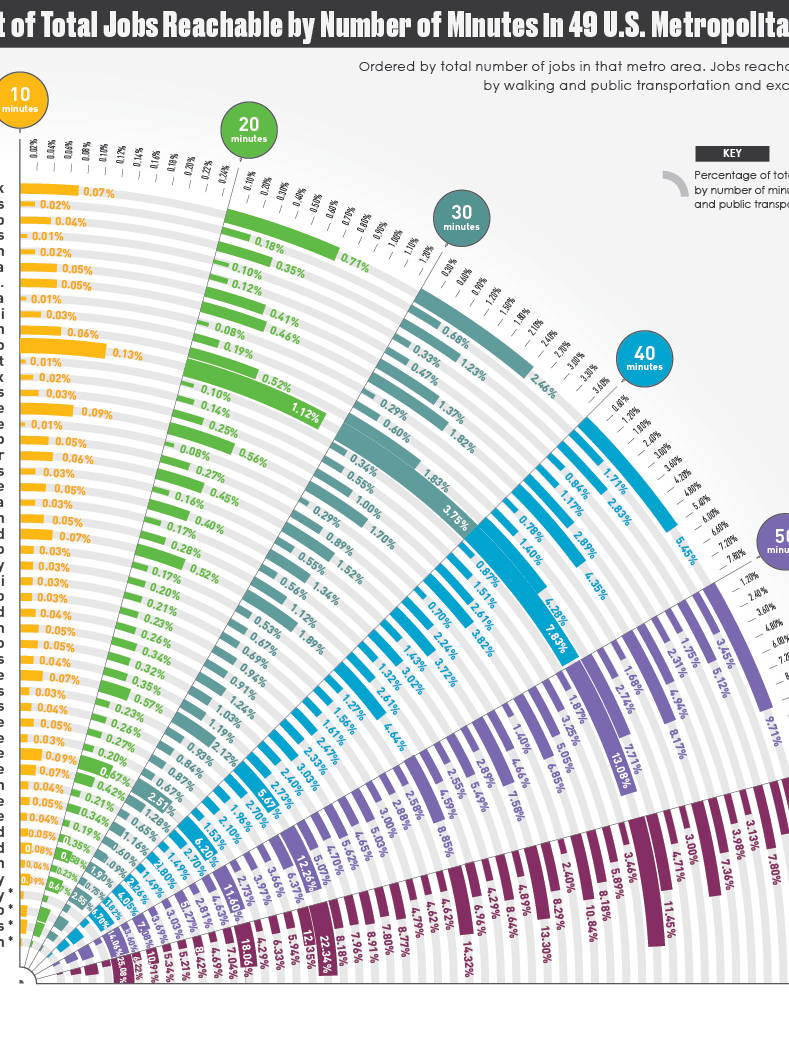
Jobs Reachable by Minutes in 49 U.S. Metropolitan Areas
2020
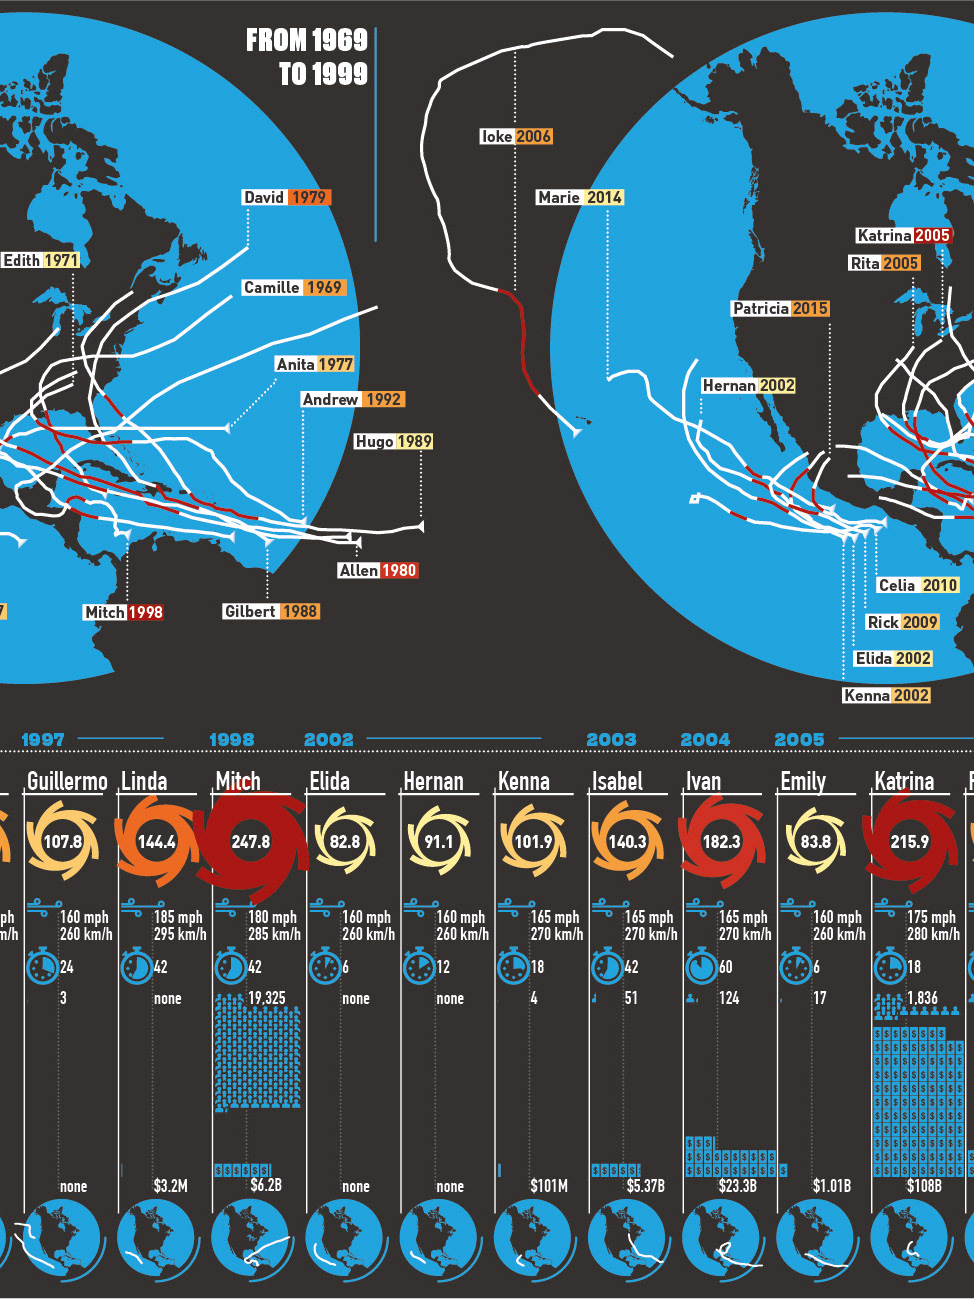
Cat 5 Hurricanes of the Past 50 Yrs for Titlemax
2019

Debts Owed To Vs Debts Owed By the U.S. for Titlemax
2019
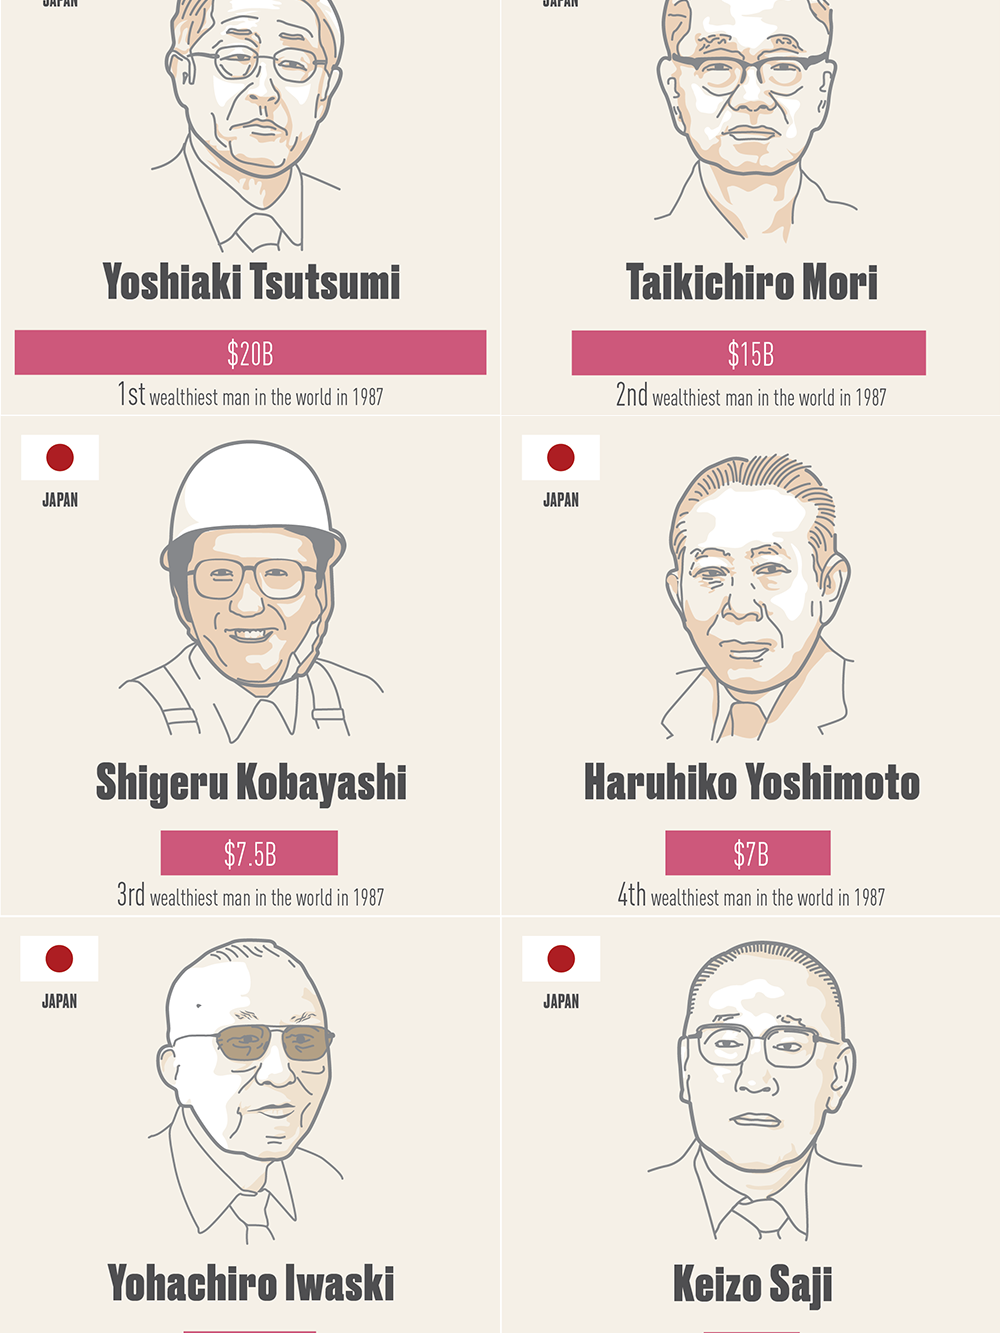
Forbes' Billionaires List
2020

I save the Planet, 101 good daily actions for climate
2022

Io Salvo il Pianeta Infographic Book with Typimedia
2022
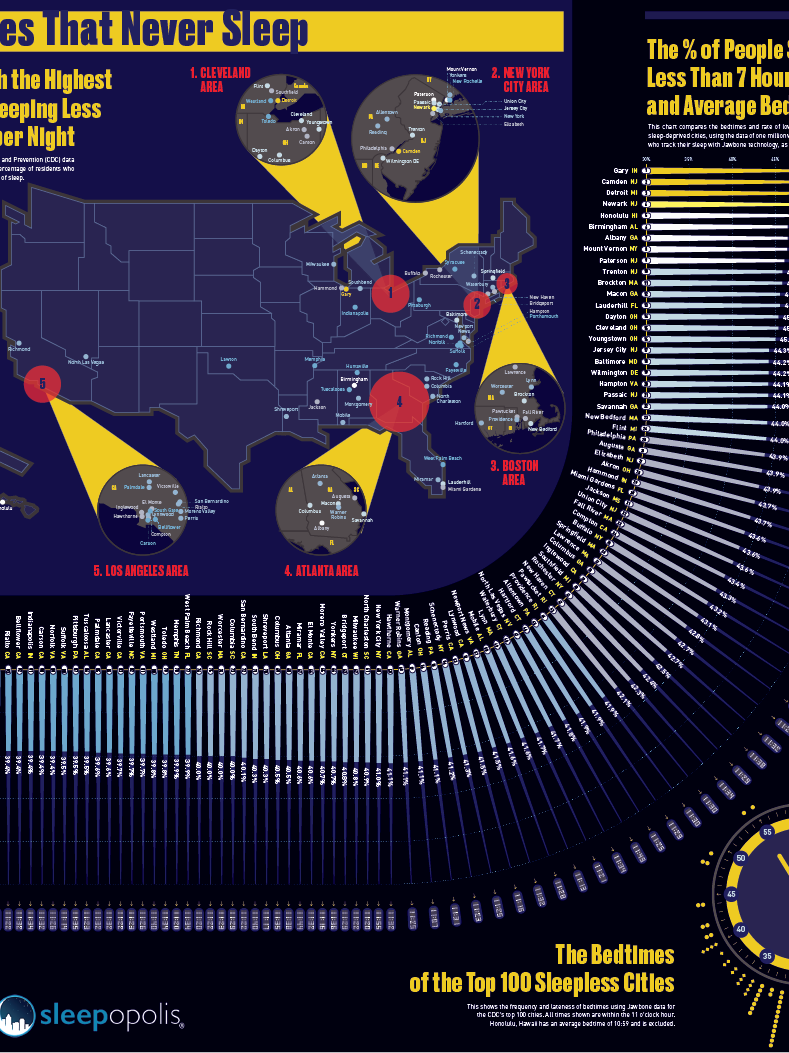
The CitiesThat Never Sleep
2019
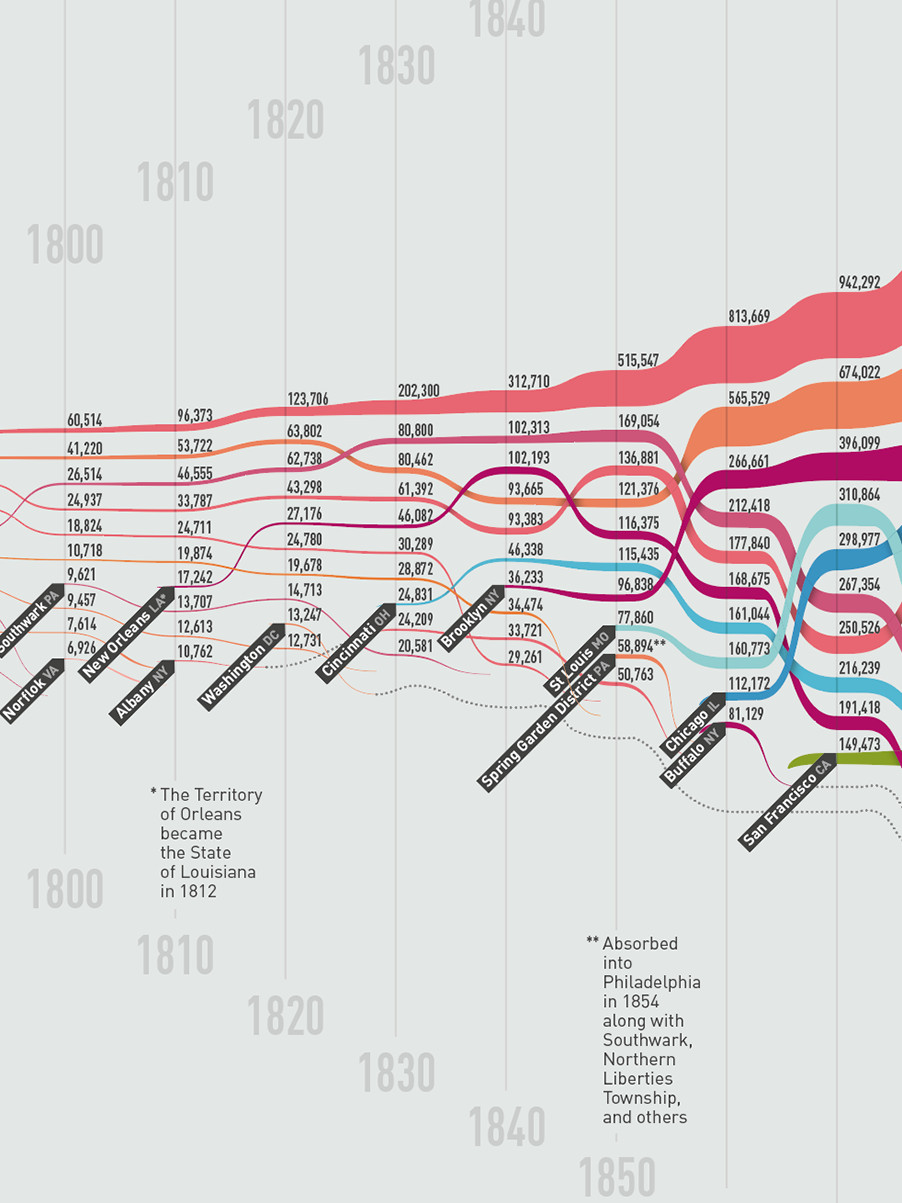
The 10 Most Populous U.S. Cities Every Decade Since 179
2019
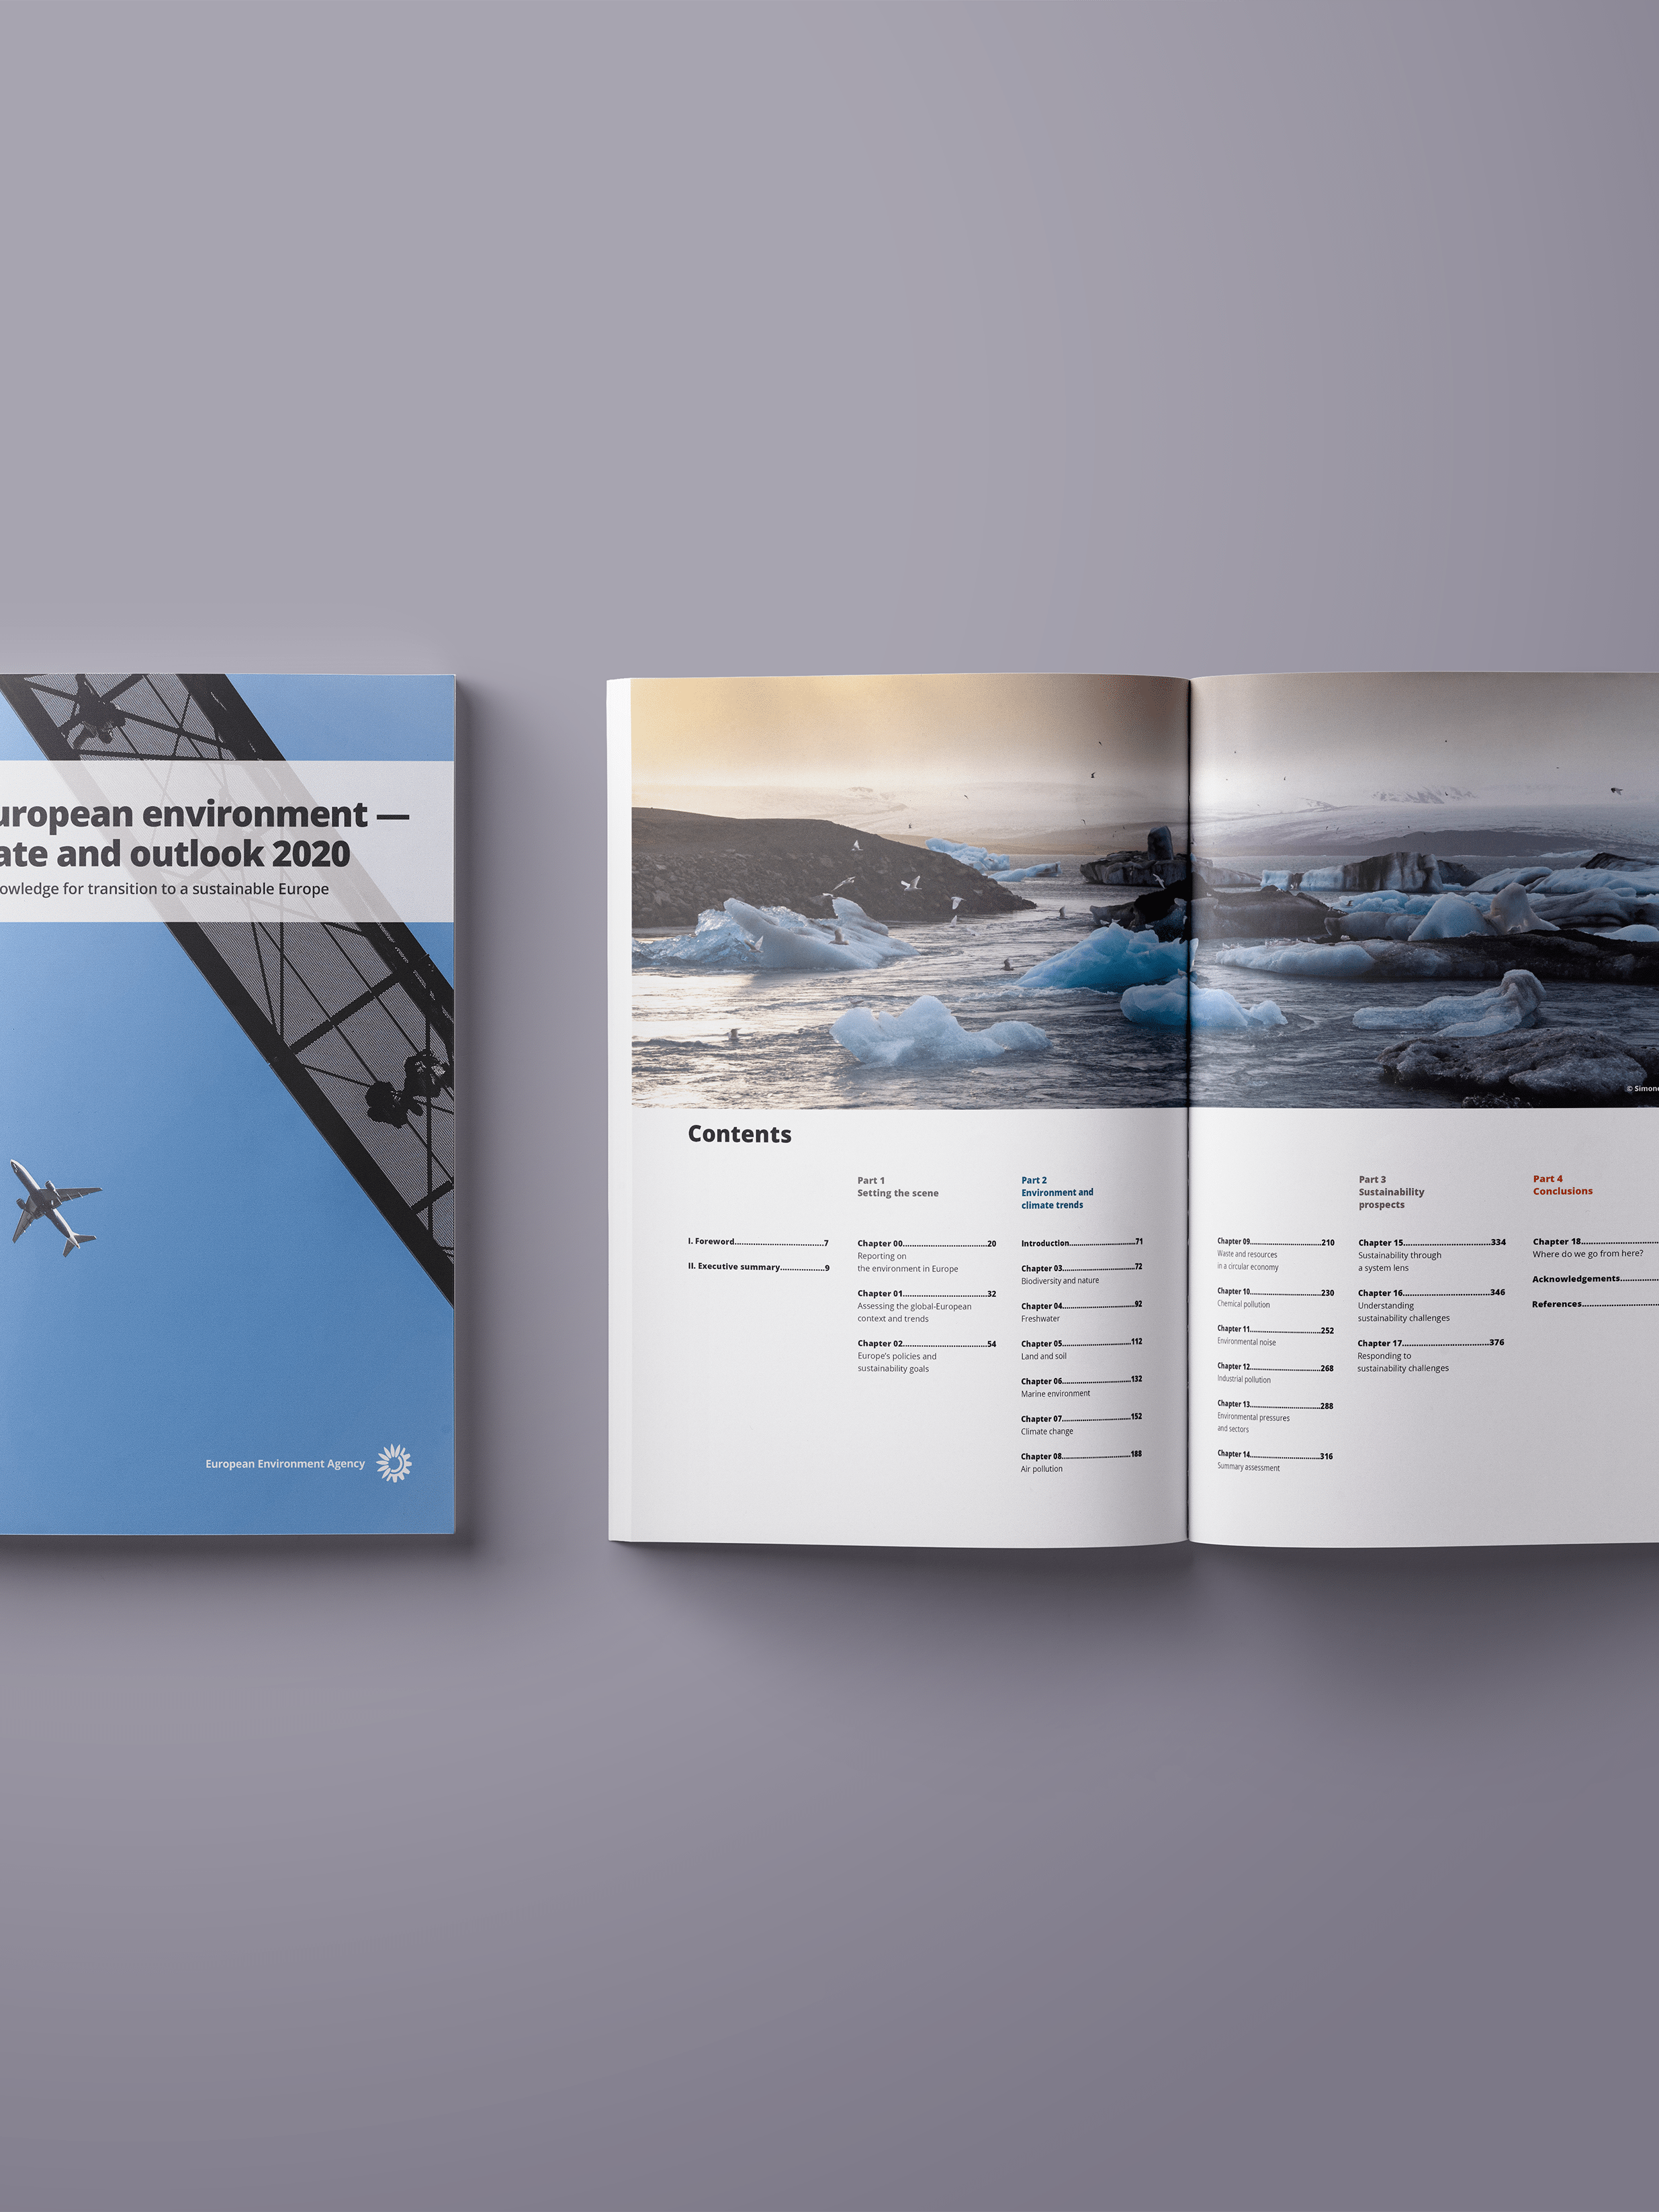
EEA's SOER 2020
2019
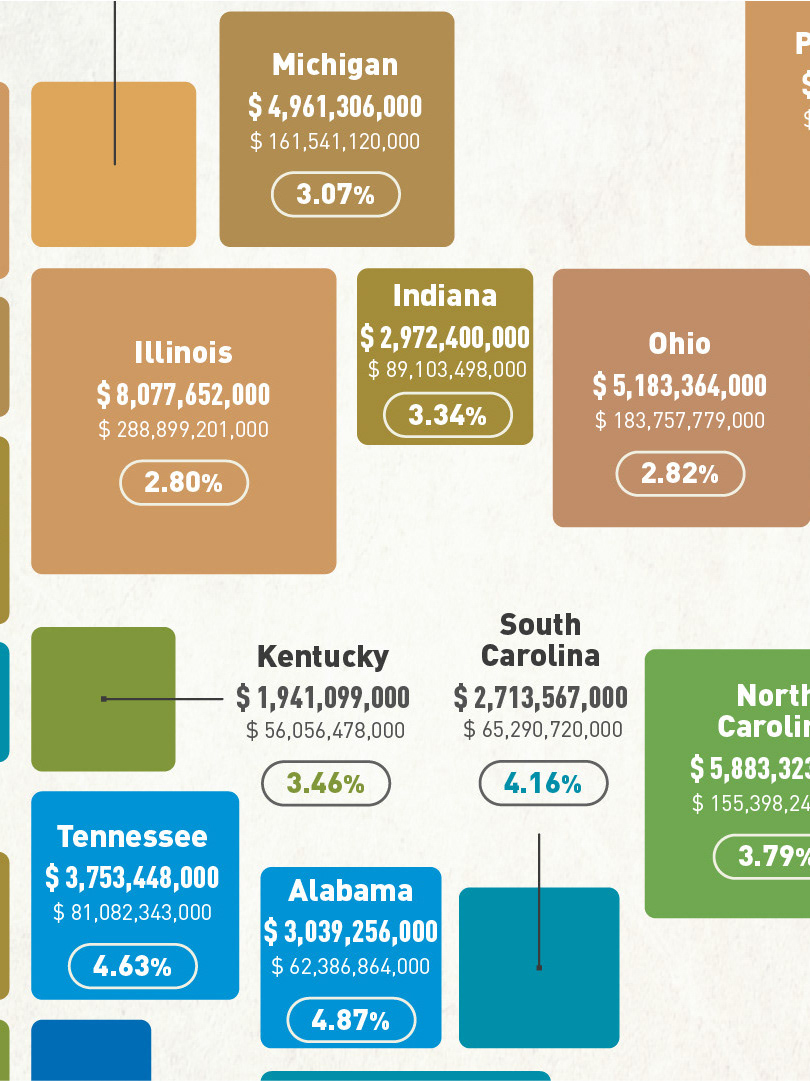
Charitable Giving in the United States
2019
